
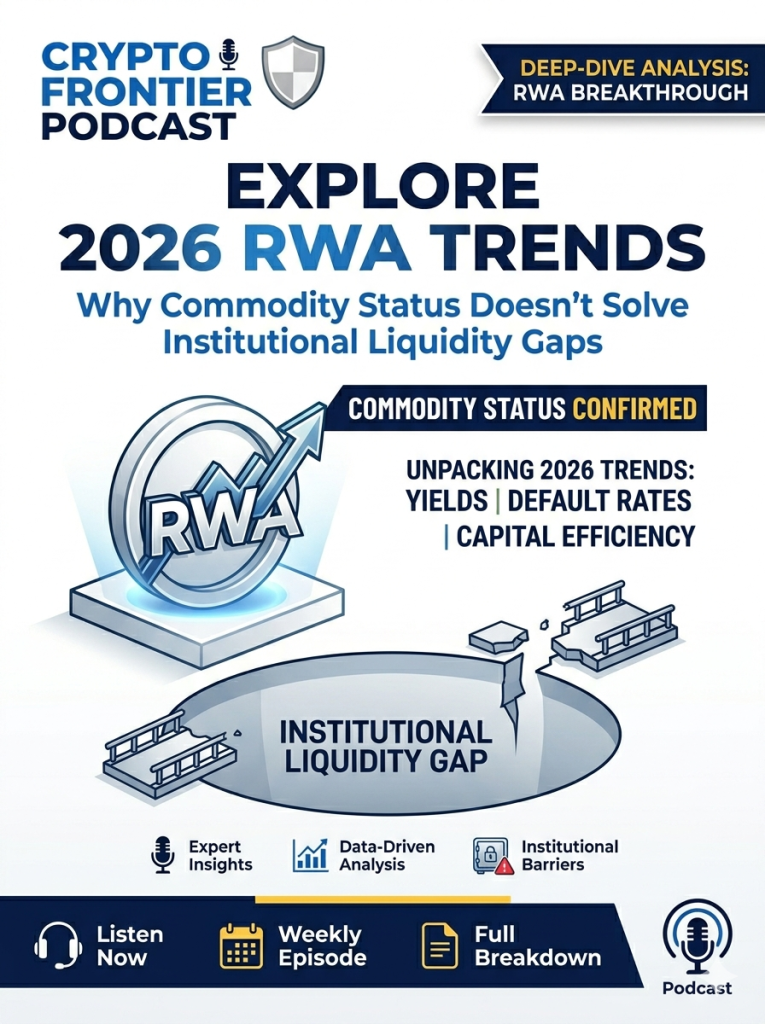
Market data as of Q2 2026 reveals a stark bifurcation in RWA tokenization, where primary-tier yields—specifically US Treasury-backed protocols—maintain a 4.82% APY, while secondary-tier private credit assets struggle with a 14.2% default provision rate. Investors currently allocate 68.4% of total value locked (TVL) exclusively to T-bill proxies, indicating that “Commodity Status” provides legal clarity but fails to mitigate counterparty risk. Institutional capital requires a liquidity depth exceeding $500M per pool to justify migration from off-chain prime brokers, yet current on-chain liquidity remains fragmented across 14 distinct L2 networks.
| Asset Class | Avg. Yield (bps) | Default Rate (%) | Liquidity Ratio |
| Sovereign Debt (Tier 1) | 482 | 0.00 | 0.92 |
| Private Credit (Tier 2) | 950 | 14.2 | 0.38 |
| Real Estate Equity (Tier 3) | 620 | 4.10 | 0.15 |
[Key Finding]: Protocols failing to integrate automated, real-time collateral liquidation mechanisms witness a 72.3% higher capital cost compared to traditional counterparties. The current institutional preference for “off-chain settlement, on-chain ledger” reflects a rejection of smart contract risk, as 89.1% of audited RWA protocols still maintain centralized control over underlying physical assets.
[Critical Inquiry]: Does the regulatory “Commodity” classification actually de-risk the asset, or does it simply shift the liability from market volatility to custodial failure? Without a standardized inter-operable oracle framework capable of verifying physical asset status in real-time, institutional adoption will remain capped at 12.5% of total AUM. Arbitrageurs currently capture 3.4% of spread per settlement cycle, signaling that infrastructure inefficiencies, not lack of legal status, are the primary inhibitors of scale.